Version Number: v1.0.0
Published Date: 20 Mar 2026
____________________________________________________________________________
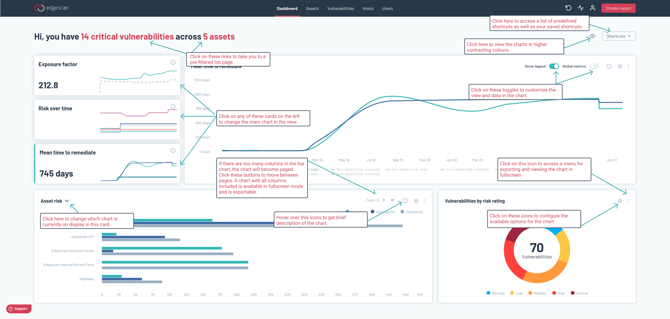
The dashboard is the first page shown on login and gives an overview of your security posture. The elements that make up the dashboard are configurable, to allow you to decide what information is the most relevant.
Default Configuration
By default the following metrics are shown:
- Mean time to remediate
- Exposure factor
- Risk over time
- Vulnerabilities by risk rating (Always in view)
- Asset risk score (configurable, see "Configuration" below)
The first three are displayed on the top half of the page, you can toggle which metric is in the main view by selecting from the options on the left.
Configuration
Clicking on the cog icon on the top right of each dashboard element brings up the configuration dialog. The text input field below it sets the title for the element. Other options will appear based on which board you select.
Which metric is shown on the bottom left chart is configurable. You can click on the name of the chart to change which chart is in view. The chart in view will be saved and shown on subsequent loads. You can choose from the following charts:
- Asset Risk Score
- Average Patch Performance
- CVSS Landscape
- Max Severity
- Remediation Performance Score
- Vulnerable Asset Percentage
Export
For charts on the dashboard, an additional control is shown to the right of the configuration button. This control allows you to export the contents of the chart to an image. Clicking this button will bring up a dialog where you can set the dimensions and format and then download an image of the chart.
Additional functionality
Page title
The page title generates some quick links to other areas of the app. The title/links are automatically generated from a set of data and may change on subsequent refreshes.
Shortcuts
Shortcuts are available in the dropdown on the top right of the page, here you will find a set of predefined shortcuts and shortcuts generated from your saved filters.
High contrast mode
To aid with visual impairment, there is a toggle to enable "High contrast mode". This can be found to the left of the shortcuts dropdown.
Available metrics
Asset Risk Score
This shows the risk scores for each asset, broken down into network, application and combined scores. The scores used in this chart are based on the vulnerability scoring system.
Average Patch Performance
This shows how your assets perform based on updating vulnerable service versions, and how your performance compares against all edgescan assets.
CVSS Landscape
This shows the percentage of your assets which have at least one vulnerability with a CVSS score above a medium (cvss 4.0) and high risk (cvss 7.0), and how your performance compares against all edgescan assets.
Exposure Factor
This shows the average risk score across all of your vulnerable assets, and how your performance compares against all edgescan assets.
Max Severity
This shows the maximum value of Severity over all your assets, and how your performance compares against all edgescan assets.
Mean Time To Remediate
This shows how your assets perform based on how quickly on average vulnerabilities are closed, and how your performance compares against all edgescan assets.
Remediation Performance Score
This shows a calculation based on how quickly vulnerabilities are remediated, with a heavier weighting given to higher risk vulnerabilities, and how your performance compares against all edgescan assets.
Risk Over Time
This shows the performance of assets over time. The scores used in this chart are based on the vulnerability scoring system.
Vulnerabilities by Risk Rating
This shows the breakdown of all vulnerabilities by risk rating.
Vulnerable Asset Percentage
This shows percentage of your assets which have at least one vulnerability having a risk rating of high or critical, and how your performance compares against all edgescan assets.